
Mathematics, 02.07.2020 07:01 nolz4066
The manager of a coffee shop wants to know if his customers’ drink preferences have changed in the past year. He knows that last year the preferences followed the following proportions – 34% Americano, 21% Cappuccino, 14% Espresso, 11% Latte, 10% Macchiato, 10% Other. In a random sample of 450 customers, he finds that 115 ordered Americanos, 88 ordered Cappuccinos, 69 ordered Espressos, 59 ordered Lattes, 44 ordered Macchiatos, and the rest ordered something in the Other category. Run a Goodness of Fit test to determine whether or not drink preferences have changed at his coffee shop. Use a 0.05 level of significance. AmericanosCapp. Observed Counts1158869594475 Expected Counts15394.56349.54545 Enter the p-value - round to 5 decimal places. Make sure you put a 0 in front of the decimal. P-value =

Answers: 1
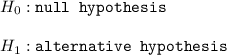
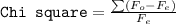
 is observed frequencies and
  is expected frequencies.

Other questions on the subject: Mathematics
Mathematics, 21.06.2019 12:40, katrinanuez
The graph below could be the graph of which exponential function?
Answers: 2
Mathematics, 21.06.2019 18:00, phamleson8697
Use the distributive law to multiply. 3(4x + 5y + 6)
Answers: 2
Mathematics, 21.06.2019 18:30, george6871
Abus travels 36 miles in 45 minutes. enter the number of miles the bus travels in 60 minutes at this rate.
Answers: 2
You know the right answer?
The manager of a coffee shop wants to know if his customers’ drink preferences have changed in the p...
Questions in other subjects:

Mathematics, 28.05.2021 21:30

Chemistry, 28.05.2021 21:30

Arts, 28.05.2021 21:30


Chemistry, 28.05.2021 21:30

Geography, 28.05.2021 21:30
Mathematics, 28.05.2021 21:30


