
Mathematics, 01.07.2020 19:01 azaz1819
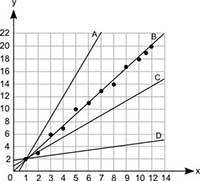
What is most likely the line of best fit for this scatter plot? (5 points) Graph shows numbers from 0 to 10 at increments of 1 on the x axis and numbers from 0 to 18 at increments of 2. Scatter plot shows ordered pairs 1, 2 and 2, 3 and 3, 6 and 4, 7 and 5, 10 and 6, 11 and 7, 13 and 8, 14 and 9, 17 and 10, 18 and 11, 19 and 12, 20. A line labeled A joins ordered pair 0.5, 0 and 7, 22. A line labeled B joins ordered pairs 0, 0 and 14, 22. A line labeled C joins ordered pairs 0, 1 and 14, 15. A line labeled D joins ordered pairs 0, 2 and 14, 5. Line A Line B Line C Line D

Answers: 1


Other questions on the subject: Mathematics
Mathematics, 21.06.2019 18:00, rosenatalie222
In triangle △abc, ∠abc=90°, bh is an altitude. find the missing lengths. ah=4 and hc=1, find bh.
Answers: 1
Mathematics, 21.06.2019 21:40, Fangflora3
The sides of a parallelogram are 24cm and 16cm. the distance between the 24cm sides is 8 cm. find the distance between the 16cm sides
Answers: 3
You know the right answer?
What is most likely the line of best fit for this scatter plot? (5 points) Graph shows numbers from...
Questions in other subjects:
Mathematics, 09.07.2019 09:30

English, 09.07.2019 09:30
Mathematics, 09.07.2019 09:30


Mathematics, 09.07.2019 09:30

History, 09.07.2019 09:30


