
Mathematics, 30.06.2020 07:01 maciemessing2
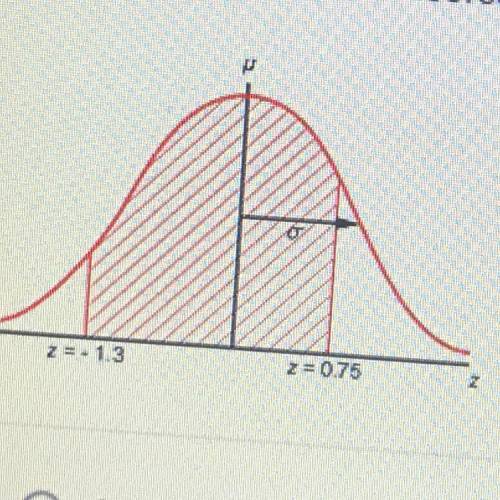
The standard normal curve shown below models the population distribution
of a random variable. What proportion of the values in the population does
not lie between the two z-scores indicated on the diagram?
u
2.1.3
20.75
A. 0.3025
B. 0.3148
C. 0.3097
D. 0.3310
E. 0.3234

Answers: 3


Other questions on the subject: Mathematics
Mathematics, 21.06.2019 17:00, Zykuko
Asays "we are both knaves" and b says nothing. exercises 24–31 relate to inhabitants of an island on which there are three kinds of people: knights who always tell the truth, knaves who always lie, and spies (called normals by smullyan [sm78]) who can either lie or tell the truth. you encounter three people, a, b, and c. you know one of these people is a knight, one is a knave, and one is a spy. each of the three people knows the type of person each of other two is. for each of these situations, if possible, determine whether there is a unique solution and determine who the knave, knight, and spy are. when there is no unique solution, list all possible solutions or state that there are no solutions. 24. a says "c is the knave," b says, "a is the knight," and c says "i am the spy."
Answers: 2
Mathematics, 21.06.2019 17:30, BreBreDoeCCx
If the class was going to get a class pet and 5 picked fish and 7 pick bird and 8 picked rabbits have many students were in the
Answers: 1
Mathematics, 21.06.2019 19:30, Cupcake8189
Which inequality has a dashed boundary line when graphed ?
Answers: 2
You know the right answer?
The standard normal curve shown below models the population distribution
of a random variable. What...
Questions in other subjects:

Mathematics, 26.07.2019 21:00


Mathematics, 26.07.2019 21:00


