
Mathematics, 29.06.2020 04:01 laurentsupreme
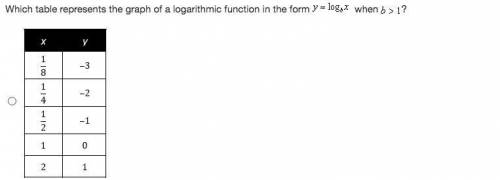
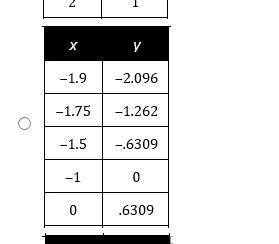
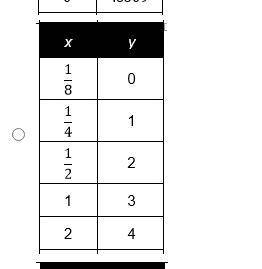
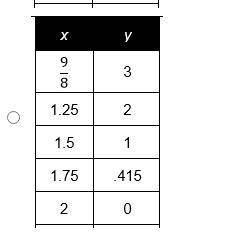
PLEASE HELP!! Which table represents the graph of a logarithmic function in the form y=log x when b < 1?

Answers: 2


Other questions on the subject: Mathematics
Mathematics, 21.06.2019 16:30, madisonenglishp2qkow
Anyone know? will mark brainliest if you're correct!
Answers: 1
Mathematics, 21.06.2019 18:00, ykpwincess
Kayla has a $500 budget for the school party. she paid $150 for the decorations. food will cost $5.50 per student. what inequality represents the number of students, s, that can attend the party?
Answers: 1
Mathematics, 21.06.2019 20:10, kingdrew27
Acolony contains 1500 bacteria. the population increases at a rate of 115% each hour. if x represents the number of hours elapsed, which function represents the scenario? f(x) = 1500(1.15)" f(x) = 1500(115) f(x) = 1500(2.15) f(x) = 1500(215)
Answers: 3
You know the right answer?
PLEASE HELP!! Which table represents the graph of a logarithmic function in the form y=log x when b...
Questions in other subjects:
Mathematics, 01.04.2021 05:30

Social Studies, 01.04.2021 05:30

Mathematics, 01.04.2021 05:30

English, 01.04.2021 05:30
Mathematics, 01.04.2021 05:30
Mathematics, 01.04.2021 05:30


