
Mathematics, 28.06.2020 06:01 ayoismeisalex
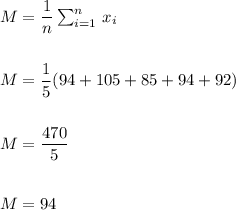
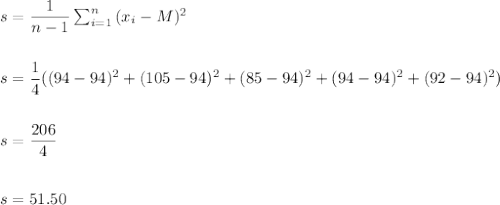
A simple random sample of 5 months of sales data provided the following information: Month: 1 2 3 4 5 Units Sold: 94 105 85 94 92 (a) Develop a point estimate of the population mean number of units sold per month. x = (b) Develop a point estimate of the population standard deviation. If required, round your answer to two decimal places. s =

Answers: 1


Other questions on the subject: Mathematics
Mathematics, 21.06.2019 13:20, areanna02
Which equation and solution can be used to solve this problem? thirteen less than a number is sixteen. 13-n=16: add 13 to both sides. the answer is 29. n+13=16: subtract 13 from both sides. the answer is 3. n+16=13 subtract 13 from both sides. the answer is 3. n-13=16: add 13 to both sides. the answer is 29.
Answers: 1
Mathematics, 21.06.2019 16:30, danielmurillo28
If c(x) = 4x – 2 and d(x) = x2 + 5x, what is (cxd)(x)
Answers: 2
Mathematics, 22.06.2019 01:00, jayjay9434
70 points ! pls 2. given the following two sets of data what is the union of the two sets and what is the intersection of the two sets. set a = {1, 2, 3, 4, 5, 6, 7, 8, 9} set b = {2, 4, 6, 8, 10, 12, 14} 3. given a regular deck of cards. describe a way of pulling cards that would create a dependent event and then one that would create an independent event. 4. what is the probability of drawing a red card and then drawing a spade without replacing the card that was drawn first?
Answers: 1
Mathematics, 22.06.2019 02:30, misk980
Atrain traveled for 1.5 hours to the first station, stopped for 30 minutes, then traveled for 4 hours to the final station where it stopped for 1 hour. the total distance traveled is a function of time. which graph most accurately represents this scenario? a graph is shown with the x-axis labeled time (in hours) and the y-axis labeled total distance (in miles). the line begins at the origin and moves upward for 1.5 hours. the line then continues upward at a slow rate until 2 hours. from 2 to 6 hours, the line continues quickly upward. from 6 to 7 hours, it moves downward until it touches the x-axis a graph is shown with the axis labeled time (in hours) and the y axis labeled total distance (in miles). a line is shown beginning at the origin. the line moves upward until 1.5 hours, then is a horizontal line until 2 hours. the line moves quickly upward again until 6 hours, and then is horizontal until 7 hours a graph is shown with the axis labeled time (in hours) and the y-axis labeled total distance (in miles). the line begins at the y-axis where y equals 125. it is horizontal until 1.5 hours, then moves downward until 2 hours where it touches the x-axis. the line moves upward until 6 hours and then moves downward until 7 hours where it touches the x-axis a graph is shown with the axis labeled time (in hours) and the y-axis labeled total distance (in miles). the line begins at y equals 125 and is horizontal for 1.5 hours. the line moves downward until 2 hours, then back up until 5.5 hours. the line is horizontal from 5.5 to 7 hours
Answers: 1
You know the right answer?
A simple random sample of 5 months of sales data provided the following information: Month: 1 2 3 4...
Questions in other subjects:
Mathematics, 24.10.2019 05:00

History, 24.10.2019 05:00


