
Mathematics, 28.06.2020 02:01 xxxanitaxxx
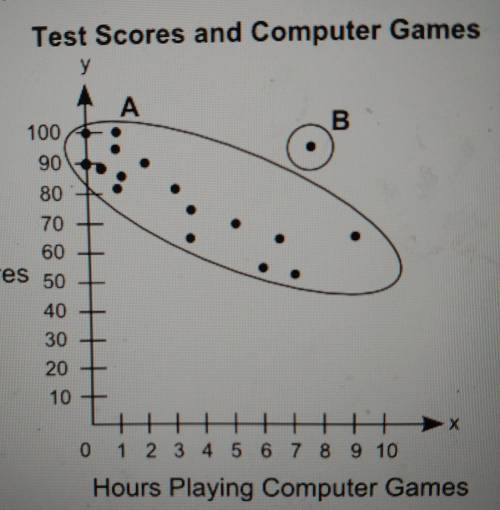
The scatter plot shows the relations between the test scores of a group of students and the number of hours they play computer games in a week:
Part A: What is the group of points labeled A called? What is the point labeled B called? Give a possible reason for the presence of point B.
Part B: Describe the association between students' test scores and the number of hours they play computer games.

Answers: 3


Other questions on the subject: Mathematics
Mathematics, 21.06.2019 19:20, cody665
1- what do you think the product of a nonzero rational number and an irrational number is? is it rational or irrational? make use of variables, the closure property of integers, and possibly a proof by contradiction to prove your hypothesis.2- why do we have to specify that the rational number must be nonzero when we determine what the product of a nonzero rational number and an irrational number is? if the rational number were 0, would it give us the same result we found in the first question?
Answers: 2
Mathematics, 21.06.2019 20:00, anthonybowie99
Write the point-slope form of the line passing through (2, -12) and parallel to y=3x.
Answers: 3
Mathematics, 21.06.2019 20:50, brea2006
An automobile assembly line operation has a scheduled mean completion time, μ, of 12 minutes. the standard deviation of completion times is 1.6 minutes. it is claimed that, under new management, the mean completion time has decreased. to test this claim, a random sample of 33 completion times under new management was taken. the sample had a mean of 11.2 minutes. assume that the population is normally distributed. can we support, at the 0.05 level of significance, the claim that the mean completion time has decreased under new management? assume that the standard deviation of completion times has not changed.
Answers: 3
You know the right answer?
The scatter plot shows the relations between the test scores of a group of students and the number o...
Questions in other subjects:


Computers and Technology, 27.09.2019 00:30
English, 27.09.2019 00:30
Mathematics, 27.09.2019 00:30


