
Mathematics, 26.06.2020 23:01 melaniegilbreath
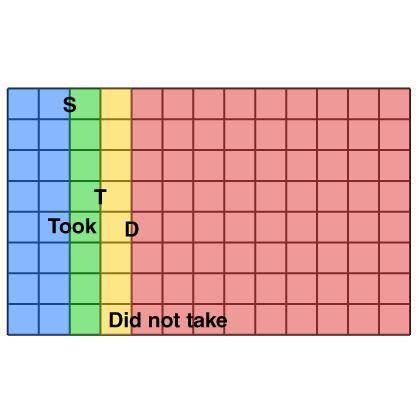
The diagram below represents three groups of students: S (blue and green): The set of students who took a Spanish class. T (green and orange): The set of students who traveled to a Spanish-speaking country. D (red and orange): The set of students who did not take a Spanish class. Each block represents one student. If a student did not travel to a Spanish-speaking country, how many times more likely is it that the student did not take Spanish? A. It is 22 times as likely. B. It is 9 times as likely. C. It is 4.5 times as likely. D. It is 2.2 times as likely.

Answers: 2


Other questions on the subject: Mathematics
Mathematics, 21.06.2019 17:30, cxttiemsp021
Is appreciated! graph the functions and approximate an x-value in which the exponential function surpasses the polynomial function. f(x) = 4^xg(x) = 4x^2options: x = -1x = 0x = 1x = 2
Answers: 1
Mathematics, 21.06.2019 18:30, Lakenwilliams1250
Select 2 statements that are true about the equation y+6=-10(x-3).1) the slope of the line is -102) the slope of the line is 33) one point on the line is (3,6)4) one point on the line is (3,-6)
Answers: 1
You know the right answer?
The diagram below represents three groups of students: S (blue and green): The set of students who t...
Questions in other subjects:

Chemistry, 13.07.2020 22:01

Health, 13.07.2020 22:01

Mathematics, 13.07.2020 22:01

Mathematics, 13.07.2020 22:01


