
Mathematics, 24.06.2020 21:01 DragonWarrior203
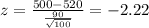
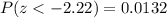
Suppose that weekly income of migrant workers doing agricultural labor in Florida has a distribution with a mean of $520 and a standard deviation of $90. A researcher randomly selected a sample of 100 migrant workers. What is the probability that sample mean is less than $500

Answers: 1
 represent the mean
 represent the standard deviation
 the sample size selected
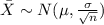


Other questions on the subject: Mathematics
Mathematics, 21.06.2019 17:30, apexdude2020
The swimming pool is open when the high temperature is higher than 20∘c. lainey tried to swim on monday and thursday (which was 33 days later). the pool was open on monday, but it was closed on thursday. the high temperature was 30 ∘c on monday, but decreased at a constant rate in the next 33 days. write an inequality to determine the rate of temperature decrease in degrees celsius per day, d, from monday to thursday.
Answers: 3
Mathematics, 21.06.2019 18:30, Lakenwilliams1250
Select 2 statements that are true about the equation y+6=-10(x-3).1) the slope of the line is -102) the slope of the line is 33) one point on the line is (3,6)4) one point on the line is (3,-6)
Answers: 1
Mathematics, 22.06.2019 01:20, blackboy21
1. why is a frequency distribution useful? it allows researchers to see the "shape" of the data. it tells researchers how often the mean occurs in a set of data. it can visually identify the mean. it ignores outliers. 2. the is defined by its mean and standard deviation alone. normal distribution frequency distribution median distribution marginal distribution 3. approximately % of the data in a given sample falls within three standard deviations of the mean if it is normally distributed. 95 68 34 99 4. a data set is said to be if the mean of the data is greater than the median of the data. normally distributed frequency distributed right-skewed left-skewed
Answers: 2
Mathematics, 22.06.2019 01:30, SGARCIA25
Have you ever been in the middle of telling a story and had to use hand gestures or even a drawing to make your point? in algebra, if we want to illustrate or visualize a key feature of a function, sometimes we have to write the function in a different form—such as a table, graph, or equation—to determine the specific key feature we’re looking for. think about interactions with others and situations you’ve come across in your own life. how have you had to adjust or change the way you represented something based on either the concept you were trying to describe or the person you were interacting with? explain how the complexity or layout of the concept required you to change your style or presentation, or how the person’s unique learning style affected the way you presented the information.
Answers: 1
You know the right answer?
Suppose that weekly income of migrant workers doing agricultural labor in Florida has a distribution...
Questions in other subjects:


Mathematics, 28.10.2020 21:30
Mathematics, 28.10.2020 21:30
History, 28.10.2020 21:30
Mathematics, 28.10.2020 21:30


