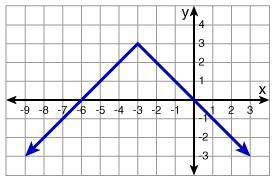
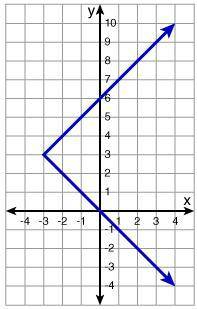
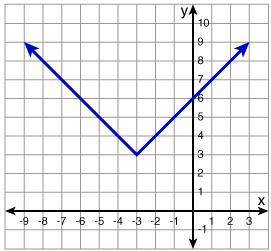
Which graph represents the function below? y -x if x > -3 x +6 if x ≤ -3
...

Mathematics, 24.06.2020 14:01 sweav901
Which graph represents the function below? y -x if x > -3 x +6 if x ≤ -3

Answers: 3


Other questions on the subject: Mathematics
Mathematics, 22.06.2019 05:00, aaronpmoore1010
Nright triangle xyz, the right angle is located at vertex y. the length of line segment xy is 12.4 cm. the length of line segment yz is 15.1 cm. which is the approximate measure of angle yzx?
Answers: 2
You know the right answer?
Questions in other subjects:

History, 28.06.2019 03:00


Mathematics, 28.06.2019 03:00

Spanish, 28.06.2019 03:00

Chemistry, 28.06.2019 03:00
History, 28.06.2019 03:00


