
Mathematics, 20.06.2020 20:57 babyboogrocks5572
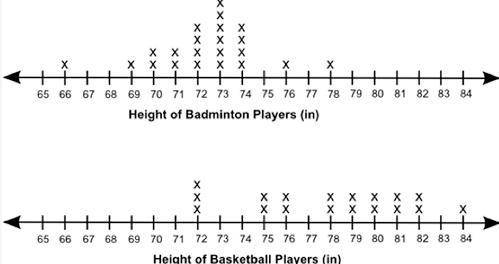
PLZ HELP:( Jake wants to compare the mean height of the players on his favorite badminton and basketball teams. He creates the dot plots shown below: The mean absolute deviation is 1.74 inches for the badminton team and 3.02 inches for the basketball team. Which of the following conclusions can be drawn from the data? The badminton players are all taller than the basketball players. The basketball players are all taller than the badminton players. There is more variability in the badminton team member heights. There is more variability in the basketball team member heights.

Answers: 2


Other questions on the subject: Mathematics
Mathematics, 21.06.2019 14:40, olivialaine31
Which graph represents the following piecewise defined function?
Answers: 2
Mathematics, 21.06.2019 17:30, nae9587
Arefrigeration system at your company uses temperature sensors fixed to read celsius (°c) values, but the system operators in your control room understand only the fahrenheit scale. you have been asked to make a fahrenheit (°f) label for the high temperature alarm, which is set to ring whenever the system temperature rises above –10°c. what fahrenheit value should you write on the label
Answers: 1
Mathematics, 21.06.2019 21:30, ojbank4411
Tom can paint the fence in 12 hours, but if he works together with a friend they can finish the job in 8 hours. how long would it take for his friend to paint this fence alone?
Answers: 1
You know the right answer?
PLZ HELP:(
Jake wants to compare the mean height of the players on his favorite badminton and baske...
Questions in other subjects:


Mathematics, 20.10.2020 02:01
Mathematics, 20.10.2020 02:01
History, 20.10.2020 02:01


Computers and Technology, 20.10.2020 02:01
Mathematics, 20.10.2020 02:01


