
Mathematics, 20.06.2020 03:57 bbqchicken243
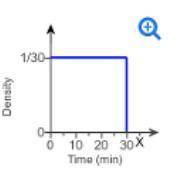
The graph to the right is the uniform density function for a friend whoThe graph to the right is the uniform density function for a friend who is x minutes late. Find the probability that the friend is at least 21 minutes late. is x minutes late. Find the probability that the friend is at least 21 minutes late.

Answers: 3


Other questions on the subject: Mathematics
Mathematics, 21.06.2019 16:30, SkyeShadow525
The length of the largest fish is 967.74 times greater than the length of the smallest fish. select a variable expression that shows the length of the largest fish, if 8 is the length of the smallest fish. a. s + 967.74 b. \[ \frac{967.74}{s} \] c. 967.74 - s d. 967. 74s
Answers: 1
Mathematics, 22.06.2019 01:10, graymonky12
The graph below shows the line of best fit for data collected on the number of cell phones and cell phone cases sold at a local electronics store on twelve different days. number of cell phone cases sold 50 * 0 5 10 15 20 25 30 35 40 45 number of cell phones sold which of the following is the equation for the line of best fit? a. y = 0.8x b. y = 0.2x c. y=0.5x d. y = 0.25x
Answers: 3
Mathematics, 22.06.2019 02:00, arlabbe0606
(30 points). the population of a city is 45,000 and decreases 2% each year. if the trend continues, what will the population be aer 15 yrs
Answers: 2
Mathematics, 22.06.2019 02:30, sassycutie523
The upcoming championship high school football game is a big deal in your little town. the problem is, it is being played in the next biggest town, which is two hours away! to get as many people as you can to attend the game, you decide to come up with a ride-sharing app, but you want to be sure it will be used before you put all the time in to creating it. you determine that if more than three students share a ride, on average, you will create the app. you conduct simple random sampling of 20 students in a school with a population of 300 students to determine how many students are in each ride-share (carpool) on the way to school every day to get a good idea of who would use the app. the following data are collected: 6 5 5 5 3 2 3 6 2 2 5 4 3 3 4 2 5 3 4 5 construct a 95% confidence interval for the mean number of students who share a ride to school, and interpret the results. part a: state the parameter and check the conditions. part b: construct the confidence interval. be sure to show all your work, including the degrees of freedom, critical value, sample statistics, and an explanation of your process. part c: interpret the meaning of the confidence interval. part d: use your findings to explain whether you should develop the ride-share app for the football game.
Answers: 3
You know the right answer?
The graph to the right is the uniform density function for a friend whoThe graph to the right is the...
Questions in other subjects:
Mathematics, 04.07.2019 15:30

Mathematics, 04.07.2019 15:30


Chemistry, 04.07.2019 15:30
Biology, 04.07.2019 15:30


