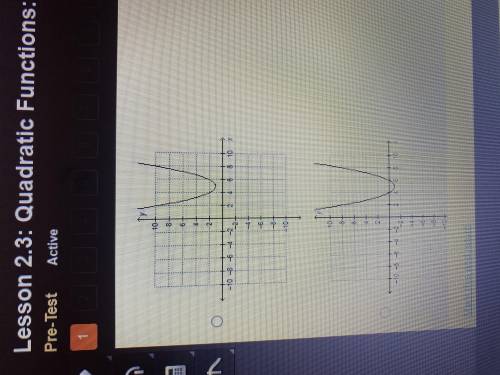
The graph f(x)=x^2 is translated to the form g(c)=(x-5)^2+1. Which graph represents g(x)
...

Mathematics, 20.06.2020 00:57 ezrasedore
The graph f(x)=x^2 is translated to the form g(c)=(x-5)^2+1. Which graph represents g(x)

Answers: 2


Other questions on the subject: Mathematics
Mathematics, 21.06.2019 23:20, lexybellx3
If f(x) = 4x - 3 and g(x) = x + 4, find (f - g) (x)
Answers: 3
Mathematics, 22.06.2019 00:30, sanfordl
1. according to the internal revenue service, the mean tax refund for the year 2007 was $2,708. assume the standard deviation is $650 and that the amounts refunded follow a normal probability distribution. a. what percent of the refunds are more than $3,000? b. what percent of the refunds are more than $3,000 but less than $4,000? c. what percent of the refunds are less than $2,000?
Answers: 2
You know the right answer?
Questions in other subjects:


History, 09.11.2019 09:31
Mathematics, 09.11.2019 09:31
Mathematics, 09.11.2019 09:31
Mathematics, 09.11.2019 09:31
Mathematics, 09.11.2019 09:31


