
Mathematics, 18.06.2020 23:57 tayjohn9774
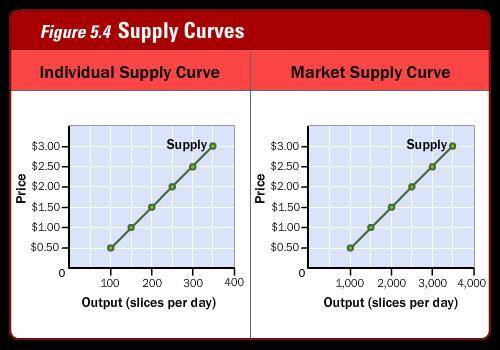
A shortage of tomato sauce causes a shift in the market supply curve for pizza. Based on the image, which point might you find on the new curve? 3,000 slices at $1.50 each 3,500 slices at $2.50 each 2,500 slices at $2.50 each 1,500 slices at $1.00 each

Answers: 2


Other questions on the subject: Mathematics
Mathematics, 21.06.2019 16:30, VgCarlos2596
What are “like terms”? why can we only add like terms?
Answers: 1
Mathematics, 21.06.2019 17:30, AzuraSchaufler
The graph below represents the number of dolphins in a dolphin sanctuary. select all the key features of this function.
Answers: 2
Mathematics, 21.06.2019 18:30, zahradawkins2007
If you are trying to move an attached term across the equal sign (=), what operation would you use to move it?
Answers: 2
Mathematics, 21.06.2019 23:30, 20lap01
(c) compare the results of parts (a) and (b). in general, how do you think the mode, median, and mean are affected when each data value in a set is multiplied by the same constant? multiplying each data value by the same constant c results in the mode, median, and mean increasing by a factor of c. multiplying each data value by the same constant c results in the mode, median, and mean remaining the same. multiplying each data value by the same constant c results in the mode, median, and mean decreasing by a factor of c. there is no distinct pattern when each data value is multiplied by the same constant. (d) suppose you have information about average heights of a random sample of airline passengers. the mode is 65 inches, the median is 72 inches, and the mean is 65 inches. to convert the data into centimeters, multiply each data value by 2.54. what are the values of the mode, median, and mean in centimeters? (enter your answers to two decimal places.) mode cm median cm mean cm in this problem, we explore the effect on the mean, median, and mode of multiplying each data value by the same number. consider the following data set 7, 7, 8, 11, 15. (a) compute the mode, median, and mean. (enter your answers to one (1) decimal places.) mean value = median = mode = (b) multiply 3 to each of the data values. compute the mode, median, and mean. (enter your answers to one (1) decimal places.) mean value = median = mode = --
Answers: 1
You know the right answer?
A shortage of tomato sauce causes a shift in the market supply curve for pizza. Based on the image,...
Questions in other subjects:


English, 12.11.2020 17:20

Biology, 12.11.2020 17:20
Mathematics, 12.11.2020 17:20
English, 12.11.2020 17:20


