Click or touch the graph to plot the points.
Y
8
Use the interactive graph to plot each s...

Mathematics, 19.06.2020 09:57 brandyrushing3
Click or touch the graph to plot the points.
Y
8
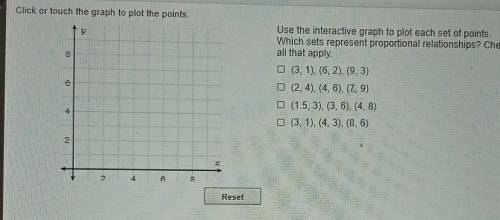
Use the interactive graph to plot each set of points.
Which sets represent proportional relationships? Check
all that apply
D (3, 1), (6,2), (9,3)
(2,4),(4, 6), (79)
10 11.5, 3), (3, 6), (4,8)
(3, 1). (4,3), (8,6)
2
4
8
no
Reset

Answers: 3


Other questions on the subject: Mathematics
Mathematics, 21.06.2019 15:00, organicmemez
If x = ∛200, which of the following inequalities is true? * 2 < x < 4 3 < x < 5 6 < x < 6.5 4.5 < x < 5.5 5 < x < 6
Answers: 1
Mathematics, 21.06.2019 16:40, kristenhernandez74
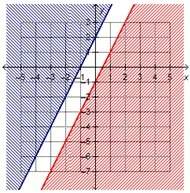
Which region represents the solution to the given system of inequalities? |-0.5x+y23 | 1.5x+ys-1 5 4 -3 -2 -1 1 2 3 4
Answers: 1
Mathematics, 21.06.2019 21:30, drepeter86
50 people men and women were asked if they watched at least one sport on tv. 20 of the people surveyed are women, but only 9 of them watch at least one sport on tv. 16 of the men watch at least one sport on tv. make a a two-way table and a relative frequency table to represent the data.
Answers: 3
You know the right answer?
Questions in other subjects:
Mathematics, 26.09.2021 14:00


Mathematics, 26.09.2021 14:00


Computers and Technology, 26.09.2021 14:00
Biology, 26.09.2021 14:00
Mathematics, 26.09.2021 14:00
Mathematics, 26.09.2021 14:00
Computers and Technology, 26.09.2021 14:00


