
Mathematics, 19.06.2020 05:57 Mordred809
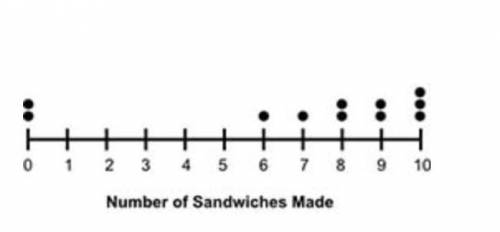
PLEASE HELP The dot plot shows the number of sandwiches made in a day by 11 chefs of a restaurant: Dot plot labeled Number of Sandwiches Made shows 2 dots over 0,1 dot over 6,1 dot over 7, 2 dot over 8, 2 dots over 9, and 3 dots over 10. Is the median or the mean a better center for this data and why?
Mean; because the data is skewed and clusters on the right
Mean; because the data is normally distributed with two outliers
Median; because the data is skewed and clusters on the right
Median; because the data is normally distributed with two outliers

Answers: 1


Other questions on the subject: Mathematics
Mathematics, 21.06.2019 18:00, jackievelasquez3424
Find the perimeter of the figure shown above. a. 18 yds c. 20 yds b. 10 yds d. 24 yds select the best answer from the choices provided
Answers: 1
Mathematics, 21.06.2019 18:30, povijuaisaiah
Use δjkl and δmpn to determine whether don's claim is true or false. which of the following should don use to prove the triangles are similar? sss sas aas aa
Answers: 1
Mathematics, 21.06.2019 18:30, BreBreDoeCCx
Solve the system of equations y= 3/2 - 1, -x+ y =-3
Answers: 1
You know the right answer?
PLEASE HELP The dot plot shows the number of sandwiches made in a day by 11 chefs of a restaurant: D...
Questions in other subjects:

Mathematics, 30.12.2020 20:10
Mathematics, 30.12.2020 20:10
Mathematics, 30.12.2020 20:10

Mathematics, 30.12.2020 20:10


