Mathematics, 17.06.2020 21:57 haydenoo72
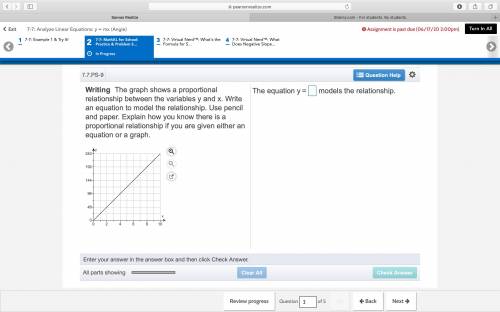
Plz HELP! ASAP: The graph shows a proportional relationship between the variables y and x. Write an equation to model the relationship. Use pencil and paper. Explain how you know there is a proportional relationship if you are given either an equation or a graph.


Answers: 1


Other questions on the subject: Mathematics


Mathematics, 21.06.2019 16:20, tmantooth7018
The lengths of nails produced in a factory are normally distributed with a mean of 4.91 centimeters and a standard deviation of 0.05 centimeters. find the two lengths that separate the top 4% and the bottom 4%. these lengths could serve as limits used to identify which nails should be rejected. round your answer to the nearest hundredth, if necessary.
Answers: 3


You know the right answer?
Plz HELP! ASAP: The graph shows a proportional relationship between the variables y and x. Write an...
Questions in other subjects:

Business, 23.08.2020 01:01

Spanish, 23.08.2020 01:01

Mathematics, 23.08.2020 01:01

Mathematics, 23.08.2020 01:01

Mathematics, 23.08.2020 01:01


Mathematics, 23.08.2020 01:01


Chemistry, 23.08.2020 01:01


