
Mathematics, 18.06.2020 21:57 EMQPWE
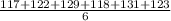
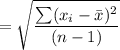
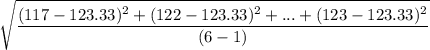
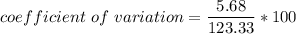
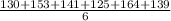
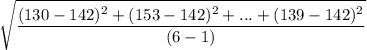
Find the coefficient of variation for each of the two sets of data, then compare the variation. Round results to one decimal place. Listed below are the systolic blood pressures (in mm Hg) for a sample of men aged 20-29 and for a sample of men aged 60-69. Group of answer choices Men aged 20-29: 4.8% Men aged 60-69: 10.6% There is substantially more variation in blood pressures of the men aged 60-69. Men aged 20-29: 4.4% Men aged 60-69: 8.3% There is substantially more variation in blood pressures of the men aged 60-69. Men aged 20-29: 4.6% Men aged 60-69: 10.2 % There is substantially more variation in blood pressures of the men aged 60-69. Men aged 20-29: 7.6% Men aged 60-69: 4.7% There is more variation in blood pressures of the men aged 20-29.

Answers: 1


Other questions on the subject: Mathematics
Mathematics, 21.06.2019 19:00, shadow29916
Solve x+3y=6 and 4x-6y=6 by elimination . show work !
Answers: 1
Mathematics, 21.06.2019 21:00, minasotpen1253
Awater tank holds 18000 gallons. how long will it take for the water level to reach 6000 gallons if the water is used at anaverage rate of 450 gallons per day
Answers: 1
You know the right answer?
Find the coefficient of variation for each of the two sets of data, then compare the variation. Roun...
Questions in other subjects:
Mathematics, 10.05.2021 01:00
Mathematics, 10.05.2021 01:00


Spanish, 10.05.2021 01:00

Physics, 10.05.2021 01:00


