
Mathematics, 17.06.2020 19:57 Atromity
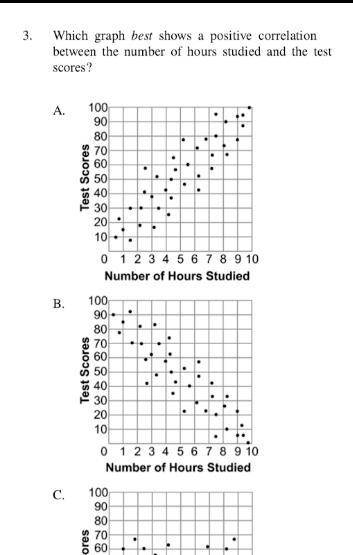
what graph best shows a positive correlation between the number of hours studied and the test scores ?

Answers: 3


Other questions on the subject: Mathematics
Mathematics, 21.06.2019 21:30, Buttercream16
Jude is making cement for a driveway. the instructions show the amount of each ingredient to make 1 batch of cement. complete each statement to adjust the ingredients for each new situation if jude uses these instructions.
Answers: 3
Mathematics, 21.06.2019 22:30, iyanistacks50
Acredit union pays 5% annual interest, compounded daily, on savings deposits. find the value after one year of $500 deposited in this account. $525.64 $25.64 $20.40 $520.40
Answers: 2
You know the right answer?
what graph best shows a positive correlation between the number of hours studied and the test scores...
Questions in other subjects:
Mathematics, 20.08.2019 20:20

Mathematics, 20.08.2019 20:20

Spanish, 20.08.2019 20:20


Biology, 20.08.2019 20:20


