
Mathematics, 17.06.2020 20:57 audjwood67
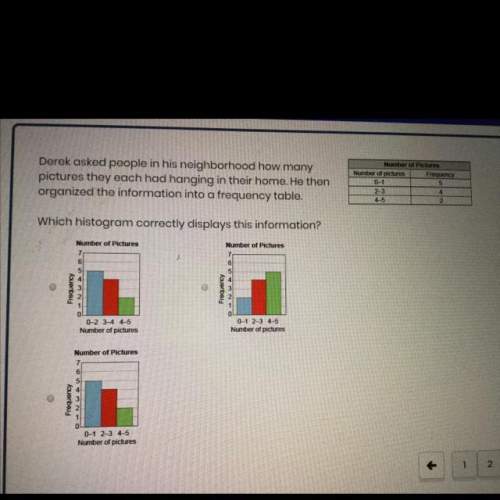
Leonard measured the mass of each pumpkin in his patch to the nearest tenth of a kilogram. He then
created both a histogram and a box plot to display the same data (both diagrams are shown below).
Which display can be used to find the maximum mass?
Choose 1 answer
The histogram
The box plot
Which display can be used to find that there were 25 pumpkins in Leonard's patch?
Choose 1 answer
The histogram
© The box plot
Mas of each pumpkin in Lond's patch

Answers: 2


Other questions on the subject: Mathematics
Mathematics, 22.06.2019 00:30, winterblanco
Answer 20 points and brainiest ! on the board, your teacher writes an example of how to find the median. one of the numbers is erased, leaving what is shown, 18, 30, 26,12 22. what is the median? a. 10 b. 20 c. 24 d. 28
Answers: 1
Mathematics, 22.06.2019 02:30, LilFreaky666
Which is true regarding the graphed function f(x)?
Answers: 1
You know the right answer?
Leonard measured the mass of each pumpkin in his patch to the nearest tenth of a kilogram. He then...
Questions in other subjects:

Business, 06.10.2019 23:00


Biology, 06.10.2019 23:00

Mathematics, 06.10.2019 23:00
Biology, 06.10.2019 23:00


