
Mathematics, 14.06.2020 23:57 kailahgranger
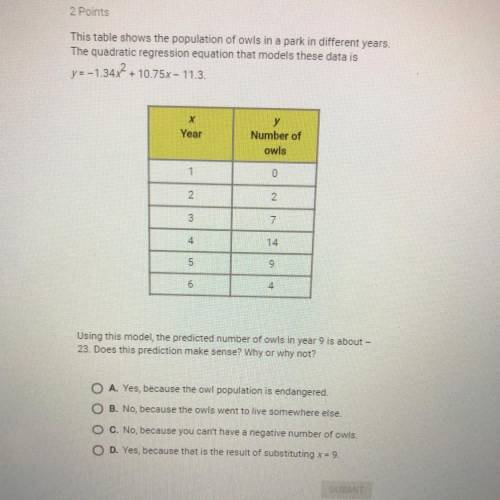
This table shows the population of owls in a park in different years.
The quadratic regression equation that models these data is
y=-1.347 + 10.75x-11.3.
х
Year
y
Number of
owls
1
0
2.
2
3
17
4.
14
5
9
6
4
Using this model, the predicted number of owls in year 9 is about -
23. Does this prediction make sense? Why or why not?
O A. Yes, because the owl population is endangered.
O B. No, because the owls went to live somewhere else.
C. No, because you can't have a negative number of owls.
O D. Yes, because that is the result of substituting x = 9.

Answers: 2


Other questions on the subject: Mathematics
Mathematics, 21.06.2019 22:00, goodperson21
White shapes and black shapes are used in a game. some of the shapes are circles. while the rest are squares. the ratio of the number of white shapes to the number of black shapes is 5: 11. the ratio of the number of white cicrles to the number of white squares is 3: 7. the ratio of the number of black circles to the number of black squres is 3: 8. work out what fraction of all the shapes are circles.
Answers: 2
Mathematics, 21.06.2019 22:10, BilliePaul95
Ellen makes and sells bookmarks. she graphs the number of bookmarks sold compared to the total money earned. why is the rate of change for the function graphed to the left?
Answers: 1
Mathematics, 21.06.2019 23:30, kiaraceballos2880
It takes an ant farm 3 days to consume 1/2 of an apple. at that rate, in how many days will the ant farm consume 3 apples
Answers: 1
You know the right answer?
This table shows the population of owls in a park in different years.
The quadratic regression equa...
Questions in other subjects:

German, 19.05.2021 02:30

Social Studies, 19.05.2021 02:30
Mathematics, 19.05.2021 02:30

Mathematics, 19.05.2021 02:30

Biology, 19.05.2021 02:30

Arts, 19.05.2021 02:30


