
Mathematics, 13.06.2020 23:57 alanihuling
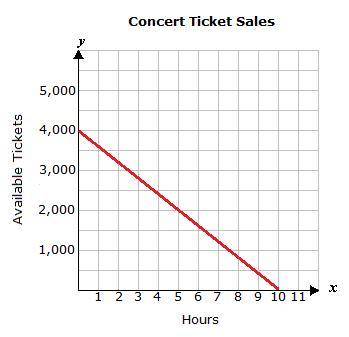
A band is planning a concert at a local theater. The graph below shows the ticket sales per hour.
What is the slope of the line shown in the graph?
A.
-400
B.
-250
C.
-2,000
D.
-1,500

Answers: 2


Other questions on the subject: Mathematics
Mathematics, 22.06.2019 02:00, fatheadd2007
Are you guys willing to me with these last 8 questions on my homework for math reply to this question that i posted
Answers: 1
You know the right answer?
A band is planning a concert at a local theater. The graph below shows the ticket sales per hour.
W...
Questions in other subjects:

English, 30.11.2019 21:31

Mathematics, 30.11.2019 21:31

Biology, 30.11.2019 21:31
Mathematics, 30.11.2019 21:31


