
Mathematics, 13.06.2020 06:57 cami30031cami3003
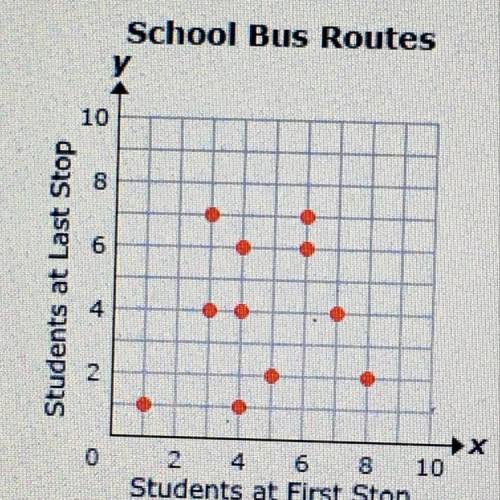
The scatter plot shows data collected on the number of students who get off the bus at the first and the last stop of various school bus routes. Which statement is true? A. The data in the scatter plot shows a negative linear correlation. B. The data in the scatter plot shows a nonlinear correlation. C. The data in the scatter plot shows a positive linear correlation. D. The data in the scatter plot shows no correlation.

Answers: 1


Other questions on the subject: Mathematics
Mathematics, 21.06.2019 13:40, Valduarte07
Solve the equation 3x2 + 19x + 9 = 0 to the nearest tenth.
Answers: 1
Mathematics, 21.06.2019 19:00, Patricia2121
Me with geometry ! in this figure, bc is a perpendicular bisects of kj. dm is the angle bisects of bdj. what is the measure of bdm? •60° •90° •30° •45°
Answers: 2
Mathematics, 21.06.2019 22:00, LilFabeOMM5889
In δabc, m∠acb = 90°, cd ⊥ ab and m∠acd = 45°. find: a find cd, if bc = 3 in
Answers: 1
You know the right answer?
The scatter plot shows data collected on the number of students who get off the bus at the first and...
Questions in other subjects:
Mathematics, 05.01.2020 09:31
Mathematics, 05.01.2020 09:31

Social Studies, 05.01.2020 09:31

Biology, 05.01.2020 09:31
Mathematics, 05.01.2020 09:31

Mathematics, 05.01.2020 09:31


