
Mathematics, 13.06.2020 05:57 keigleyhannah30
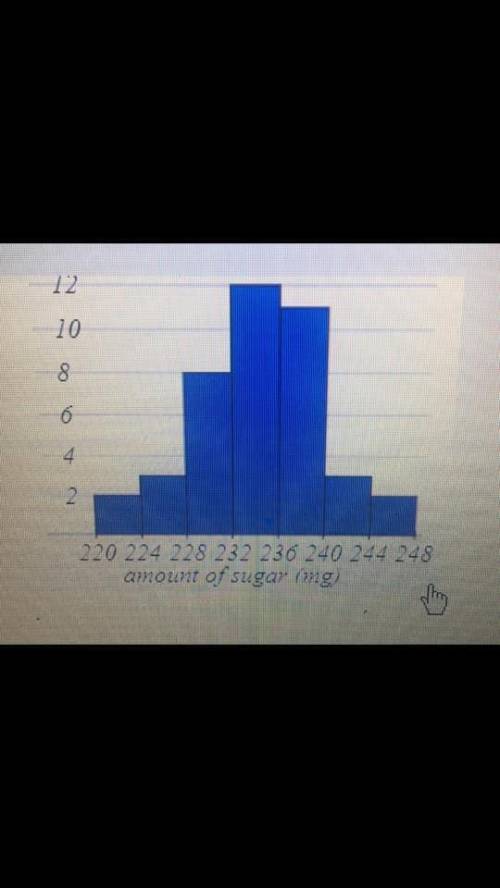
Data was collected for a sample of organic snacks. The amount of sugar (in mg) in each snack is summarized in the histogram below. Which statement best describes the meaning of one of the bars in the histogram?
2
4
6
8
10
12
amount of sugar (mg)
220
224
228
232
236
240
244
248
Frequency
2 snacks have about 226 mg of sugar.
226 snacks have 2 mg of sugar.
226 snacks have between 224 and 228 mg of sugar.
The largest number of snacks have 12 mg of sugar

Answers: 2


Other questions on the subject: Mathematics
You know the right answer?
Data was collected for a sample of organic snacks. The amount of sugar (in mg) in each snack is summ...
Questions in other subjects:
Mathematics, 22.01.2021 18:40


Biology, 22.01.2021 18:40
Mathematics, 22.01.2021 18:40
Mathematics, 22.01.2021 18:40

Mathematics, 22.01.2021 18:40


