
Mathematics, 12.06.2020 20:57 KindaSmartPersonn
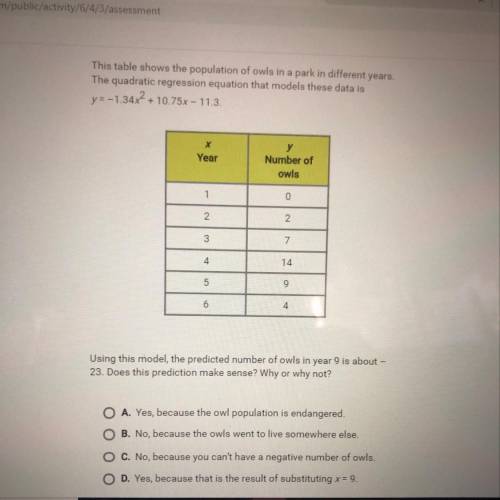
This table shows the population of owls in a park in different years.
The quadratic regression equation that models these data is
y=-1.34x2 + 10.75x - 11.3.
Year
Number of
owls
1
0
2
2
3
7
4
14
on
9
6
4.
Using this model, the predicted number of owls in year 9 is about -
23. Does this prediction make sense? Why or why not?
A. Yes, because the owl population is endangered.
B. No, because the owls went to live somewhere else.
C. No, because you can't have a negative number of owls.
D. Yes, because that is the result of substituting * = 9

Answers: 3


Other questions on the subject: Mathematics
Mathematics, 21.06.2019 21:20, rgilliam3002
Which of the following can be used to explain a statement in a geometric proof?
Answers: 2
Mathematics, 22.06.2019 01:30, zariah10191101
What is the remainder when 3x^2-x-10 is divided by x-1 -6,-7,-8, or -9
Answers: 1
Mathematics, 22.06.2019 02:30, aidenmanpig
Match each set of points with the quadratic function whose graph passes through those points
Answers: 1
Mathematics, 22.06.2019 03:00, Javi7780
Rose and andrew are financing $128,000 to purchase a condominium. they obtained a 15-year, fixed-rate loan with a rate of 5.05%. they have been given the option of purchasing up to four points to lower their rate to 4.81%. how much will the four points cost them?
Answers: 2
You know the right answer?
This table shows the population of owls in a park in different years.
The quadratic regression equa...
Questions in other subjects:


History, 25.01.2021 09:40
Mathematics, 25.01.2021 09:40

Biology, 25.01.2021 09:40
Mathematics, 25.01.2021 09:40

English, 25.01.2021 09:40
Mathematics, 25.01.2021 09:40


