Step-by-step explanation:
We're going to use the slope formula which is 
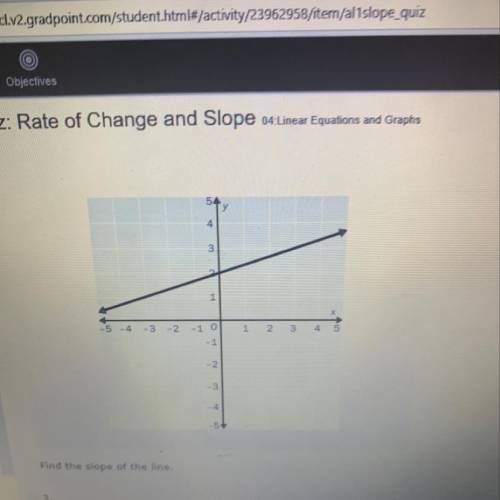
First, pick two points from the graph.
It's a bit hard to make out from the photo but it looks like (0,2) and (3,3) are both points on the line.
Let's make (0,2) be (x1, y1) and (3,3) be (x2,y2)
Substitute those points into our slope formula.

= 
So the slope is 1/3.
Tip: An easy way to see at first glance if your slope is going to be negative or positive, is to see if it's moving up or down as you look at it from left to right. In this case, the graph is moving up as you look from left to right, so the graph will be positive.