
Mathematics, 12.06.2020 00:57 theojw
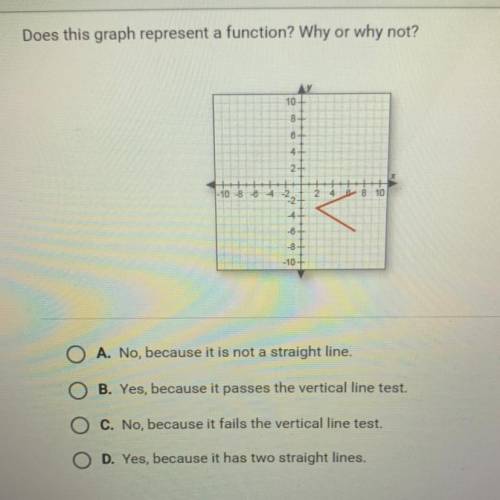
Does this graph represent a function? Why or why not?
A. No, because it is not a straight line.
B. Yes, because it passes the vertical line test.
C. No, because it fails the vertical line test.
D. Yes, because it has two straight lines,

Answers: 2


Other questions on the subject: Mathematics
Mathematics, 21.06.2019 16:50, lunamoon1
The rate of decay of a radioactive substance depends upon the amount present initially. the mass y (mg) of the radioactive substance cobalt-60 present in a sample at time t (years) is represented by the exponential equation y=50e −0.1315 t . answer the following questions in complete sentences. 1. how does the exponential equation above compare to the equation for simple interest that is compounded continuously? explain the similarities. 2. what is the initial amount of cobalt-60 in the sample? 2. how much cobalt-60 is left after 8.4 years? show your work. 3. what would be the y-intercept of the graph? what does it represent? 4. after how many years will the amount of cobalt-60 left be 6.25 mg? explain what happens to the cobalt-60 after 50 years? 5. discuss some “real-world” examples and uses of cobalt-60
Answers: 1
Mathematics, 21.06.2019 19:00, coryowens44
Write a fraction less than 1, which has a denominator of 6 and is greater than 3/4 plz answer !
Answers: 1
Mathematics, 21.06.2019 21:30, fheight01
Name and describe the three most important measures of central tendency. choose the correct answer below. a. the mean, sample size, and mode are the most important measures of central tendency. the mean of a data set is the sum of the observations divided by the middle value in its ordered list. the sample size of a data set is the number of observations. the mode of a data set is its highest value in its ordered list. b. the sample size, median, and mode are the most important measures of central tendency. the sample size of a data set is the difference between the highest value and lowest value in its ordered list. the median of a data set is its most frequently occurring value. the mode of a data set is sum of the observations divided by the number of observations. c. the mean, median, and mode are the most important measures of central tendency. the mean of a data set is the product of the observations divided by the number of observations. the median of a data set is the lowest value in its ordered list. the mode of a data set is its least frequently occurring value. d. the mean, median, and mode are the most important measures of central tendency. the mean of a data set is its arithmetic average. the median of a data set is the middle value in its ordered list. the mode of a data set is its most frequently occurring value.
Answers: 3
Mathematics, 22.06.2019 01:30, Sprout7430
The angle of elevation from point a to the top of the cliff is 38 degrees. if point a is 80 feet from the base of the cliff , how high is the cliff ?
Answers: 2
You know the right answer?
Does this graph represent a function? Why or why not?
A. No, because it is not a straight line.
Questions in other subjects:

Mathematics, 16.10.2019 02:30

Mathematics, 16.10.2019 02:30

Biology, 16.10.2019 02:30
Mathematics, 16.10.2019 02:30
Mathematics, 16.10.2019 02:30

History, 16.10.2019 02:30


