
Mathematics, 10.06.2020 21:57 joThompson
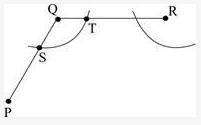
Naomi draws a portion of a figure as shown. She wants to construct a line segment through R that makes the same angle with line segment QR as line segment PQ, as shown below:
(First image)
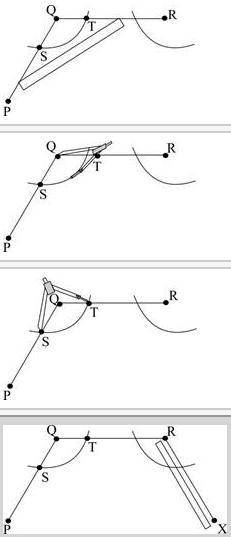
Which figure shows the next step to construct a congruent angle at R?
(second image)

Answers: 1


Other questions on the subject: Mathematics
Mathematics, 21.06.2019 17:30, taylor5384
At a sale this week, a desk is being sold for $213. this is a 29% discount from the original price. what is the original price?
Answers: 1
Mathematics, 21.06.2019 23:00, jnsoccerboy7260
The perimeter of a rectangular rug is 24 feet. the length of the rug is 1 2/5 i s width. what is the area of the rug
Answers: 2
Mathematics, 21.06.2019 23:30, reycaden
The number of members f(x) in a local swimming club increased by 30% every year over a period of x years. the function below shows the relationship between f(x) and x: f(x) = 10(1.3)xwhich of the following graphs best represents the function? graph of f of x equals 1.3 multiplied by 10 to the power of x graph of exponential function going up from left to right in quadrant 1 through the point 0, 0 and continuing towards infinity graph of f of x equals 10 multiplied by 1.3 to the power of x graph of f of x equals 1.3 to the power of x
Answers: 1
Mathematics, 22.06.2019 02:30, Leii691
According to a research study, parents with young children slept 6.4 hours each night last year, on average. a random sample of 18 parents with young children was surveyed and the mean amount of time per night each parent slept was 6.8. this data has a sample standard deviation of 0.9. (assume that the scores are normally distributed.) researchers conduct a one-mean hypothesis at the 5% significance level, to test if the mean amount of time parents with young children sleep per night is greater than the mean amount of time last year. the null and alternative hypotheses are h0: μ=6.4 and ha: μ> 6.4, which is a right-tailed test. the test statistic is determined to be t0=1.89 using the partial t-table below, determine the critical value(s). if there is only one critical value, leave the second answer box blank.
Answers: 3
You know the right answer?
Naomi draws a portion of a figure as shown. She wants to construct a line segment through R that mak...
Questions in other subjects:

Mathematics, 11.02.2022 14:00

English, 11.02.2022 14:00
History, 11.02.2022 14:00
SAT, 11.02.2022 14:00


