
Mathematics, 11.06.2020 08:57 mahoganyking16
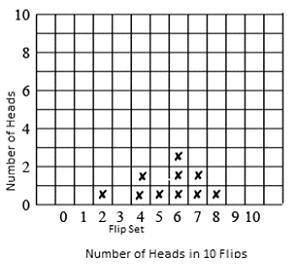
1. Draw a histogram from all the data. Starting at the bottom row, for each set of 10 flips, place an “x” in the column corresponding to the number of heads that set produced. Your histogram should look similar to the example below: 2. Calculate the mean and standard deviation. mean = _, standard deviation = _ 3. Calculate the percent of the data that is within 1, 2, and 3 standard deviations of the mean. within 1 standard deviation = _% within 2 standard deviations = _% within 3 standard deviations = _% 4. Compare your results to a normal distribution. Interpret any differences.

Answers: 1


Other questions on the subject: Mathematics
Mathematics, 21.06.2019 19:00, mbalderp5bxjo
Billy plotted −3 4 and −1 4 on a number line to determine that −3 4 is smaller than −1 4 is he correct? explain why or why not?
Answers: 3
Mathematics, 21.06.2019 23:00, sugar1014
According to a study conducted in 2015, 18% of shoppers said that they prefer to buy generic instead of name-brand products. suppose that in a recent sample of 1500 shoppers, 315 stated that they prefer to buy generic instead of name-brand products. at a 5% significance level, can you conclude that the proportion of all shoppers who currently prefer to buy generic instead of name-brand products is higher than .18? use both the p-value and the critical-value approaches.
Answers: 1
Mathematics, 21.06.2019 23:10, danielacortevpe3i66
12 3 4 5 6 7 8 9 10time remaining01: 24: 54which graph represents this system? y=1/2x + 3 y= 3/2x -1
Answers: 1
You know the right answer?
1. Draw a histogram from all the data. Starting at the bottom row, for each set of 10 flips, place a...
Questions in other subjects:

Health, 31.10.2019 19:31

English, 31.10.2019 19:31
Health, 31.10.2019 19:31


History, 31.10.2019 19:31


