
Mathematics, 10.06.2020 23:57 leslie1811
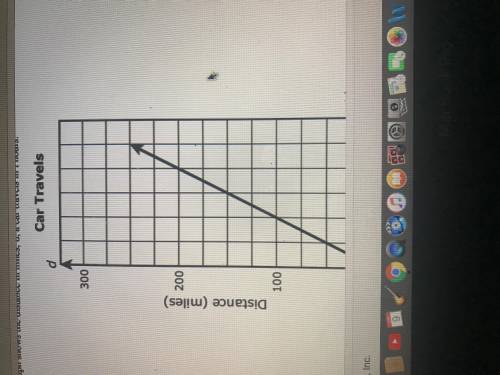
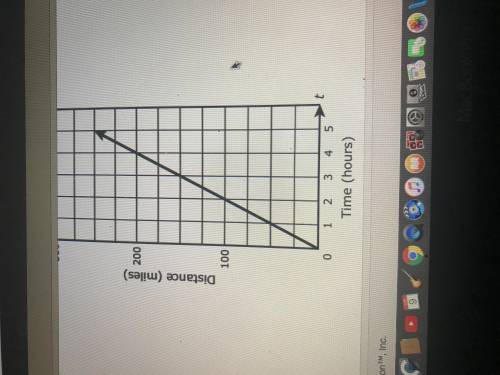
The graph shows the distance in miles, d, a car travels in t hours explain why the graph does or does not represent a proportional relationship between the variables d and t

Answers: 1


Other questions on the subject: Mathematics
Mathematics, 20.06.2019 18:04, jackfooman3100
Afudge recipe calls for 1/2 cup of cocoa if only 1/2 of the recipe is made to how much cocoa should you use
Answers: 1
Mathematics, 21.06.2019 17:30, Jcmandique3444
Consider the graph of the exponential function y=3(2)×
Answers: 1
You know the right answer?
The graph shows the distance in miles, d, a car travels in t hours
explain why the graph does or do...
Questions in other subjects:

English, 15.01.2021 08:40
Mathematics, 15.01.2021 08:40

Social Studies, 15.01.2021 08:40
Mathematics, 15.01.2021 08:40
Mathematics, 15.01.2021 08:40

Mathematics, 15.01.2021 08:40


