
These box plots show daily low temperatures for a sample of days in two
different towns.
Town...

Mathematics, 10.06.2020 18:57 wrolle
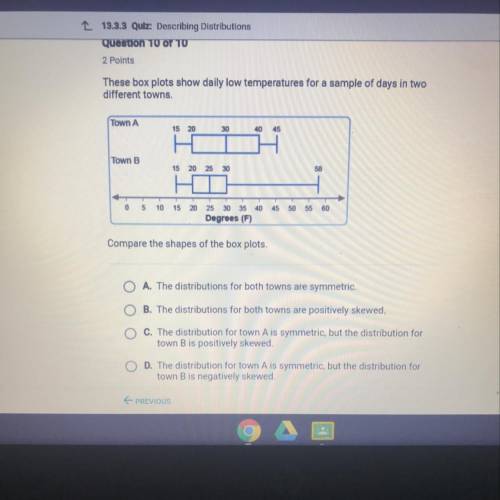
These box plots show daily low temperatures for a sample of days in two
different towns.
Town A
15 20
30
40 45
Town B
15 20 25 30
58
0
5
10
15
45
50
55
60
20 25 30 35 40
Degrees (F)
Compare the shapes of the box plots.

Answers: 3


Other questions on the subject: Mathematics
Mathematics, 21.06.2019 20:30, alexialiles19
Max recorded the heights of 500 male humans. he found that the heights were normally distributed around a mean of 177 centimeters. which statements about max’s data must be true? a) the median of max’s data is 250 b) more than half of the data points max recorded were 177 centimeters. c) a data point chosen at random is as likely to be above the mean as it is to be below the mean. d) every height within three standard deviations of the mean is equally likely to be chosen if a data point is selected at random.
Answers: 2
Mathematics, 21.06.2019 22:10, ava789
Find the volume of the solid whose base is the region bounded by f(x), g(x) and the x-axis on the interval [0, 1], and whose cross-sections perpendicular to the y-axis are squares. your work must show the integral, but you may use your calculator to evaluate it. give 3 decimal places for your answe
Answers: 3
Mathematics, 21.06.2019 23:00, tylerchitwood211
Ithink i know it but i want to be sure so can you me out ?
Answers: 1
You know the right answer?
Questions in other subjects:


Mathematics, 24.07.2020 03:01
Mathematics, 24.07.2020 03:01

Health, 24.07.2020 03:01


