
Mathematics, 09.06.2020 19:57 brayden2275
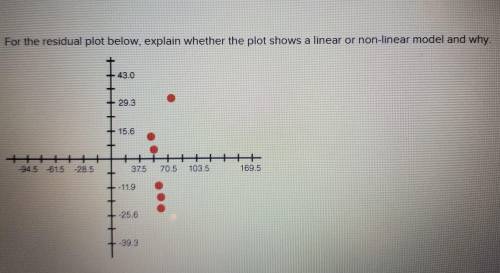
For the residual plot below, explain whether the plot shows a linear or non-linear model and why. See attached

Answers: 2


Other questions on the subject: Mathematics
Mathematics, 21.06.2019 18:00, mallorybranham
Solve the equation -9p - 17 =10 a -3 b. 16 c. 18 d -16
Answers: 2
Mathematics, 21.06.2019 23:00, sjjarvis53211
Mrs. sling bought a pound of green beans for $1.80. how much will mrs. tennison pay for 3 1/2 pounds of green beans?
Answers: 1
You know the right answer?
For the residual plot below, explain whether the plot shows a linear or non-linear model and why.
S...
Questions in other subjects:


Mathematics, 24.11.2020 03:50

English, 24.11.2020 03:50
Mathematics, 24.11.2020 03:50

Mathematics, 24.11.2020 03:50


