
Mathematics, 09.06.2020 18:57 samm2002
A survey was sent out to compare the proportion of adults who use their car horns when driving for two age populations (1=younger adults, defined as between 20 and 39 years old and 2 =older adults, defined as over 60 years old). The following data was obtained from those who responded.
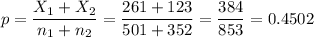
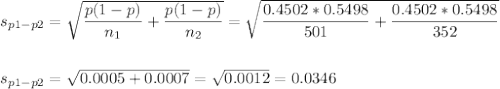
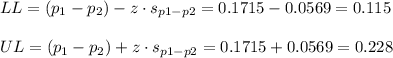
Calculate the 90% confidence interval using the standard normal distribution. Note that 1 =0.52. P2= 0.35, and s. e.(P1-P2) =0.0338. Round to the fourth decimal point. Please enter you answer in the following format: (lower value, upper value)
Use the horn Use the horn
Group Yes No Total
1= younger adults 261 240 501
2= older adults 123 229 352

Answers: 3


Other questions on the subject: Mathematics
Mathematics, 21.06.2019 18:00, sophiamoser
Julius sold five times as many computers as sam sold last year. in total, they sold 78 computers. how many computers did julius sell?
Answers: 1
Mathematics, 21.06.2019 21:00, newsome1996p4ggft
5x−4≥12 or 12x+5≤−4 can you with this problem
Answers: 3
You know the right answer?
A survey was sent out to compare the proportion of adults who use their car horns when driving for t...
Questions in other subjects:

Mathematics, 11.01.2021 23:30

Mathematics, 11.01.2021 23:30
Mathematics, 11.01.2021 23:30
Mathematics, 11.01.2021 23:30

English, 11.01.2021 23:30


