
Find the mean of the data in the dot plot below.
fish
h
Fish Emma caught each day
of...

Mathematics, 06.06.2020 14:57 alexacarillo
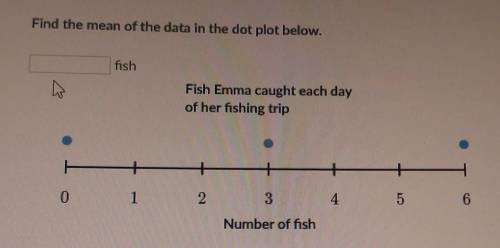
Find the mean of the data in the dot plot below.
fish
h
Fish Emma caught each day
of her fishing trip
+
0
1
1
2
3
4
5
6
Number of fish

Answers: 2


Other questions on the subject: Mathematics
Mathematics, 22.06.2019 01:20, lauretta
Aprobability experiment is conducted in which the sample space of the experiment is s={7,8,9,10,11,12,13,14,15,16,17,18 }, event f={7,8,9,10,11,12}, and event g={11,12,13,14}. assume that each outcome is equally likely. list the outcomes in f or g. find p(f or g) by counting the number of outcomes in f or g. determine p(f or g) using the general addition rule.
Answers: 2
You know the right answer?
Questions in other subjects:

Geography, 07.10.2019 00:00


English, 07.10.2019 00:00

Computers and Technology, 07.10.2019 00:00
History, 07.10.2019 00:00

Chemistry, 07.10.2019 00:00
Mathematics, 07.10.2019 00:00


