
Mathematics, 07.06.2020 00:04 fgcherubin
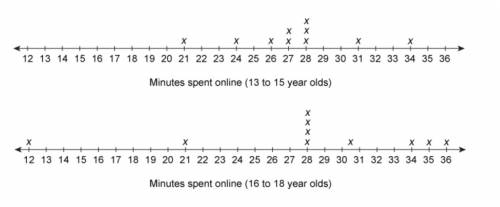
The line plots show the number of minutes two different age groups of teenagers spent online the previous week.
Select from the drop-down menus to complete each statement.
1) The range is _.
a) is greater for data set one (13-15-year-olds)
b) is greater for data set two (16 to 18-year-olds)
c) is the same for both sets of data
2) The mean _.
a) is the same for both sets of data
b) is greater for data set one (13-15-year-olds)
c) is greater for data set two (16 to 18-year-olds)

Answers: 3


Other questions on the subject: Mathematics
Mathematics, 21.06.2019 17:30, Jcmandique3444
Consider the graph of the exponential function y=3(2)×
Answers: 1
Mathematics, 21.06.2019 21:00, minasotpen1253
Awater tank holds 18000 gallons. how long will it take for the water level to reach 6000 gallons if the water is used at anaverage rate of 450 gallons per day
Answers: 1
You know the right answer?
The line plots show the number of minutes two different age groups of teenagers spent online the pre...
Questions in other subjects:

Chemistry, 02.10.2019 02:00


English, 02.10.2019 02:00


Health, 02.10.2019 02:00
History, 02.10.2019 02:00


