
Mathematics, 07.06.2020 04:58 jessicachichelnitsky
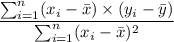
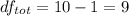
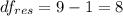
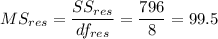
A researcher collected data on the hours of TV watched per day from a sample of five people of different ages. Here are the results:i Age TV Hrs 1 43 1 2 30 6 3 22 4 4 20 3 5 5 6 1. Calculate the least squares estimated regression equation using simple linear regression. 2. What is the independent variable in this study?a) {y}b) agec) tv hoursd) Ie) 53) Create an ANOVA table. Using α=.05.

Answers: 1
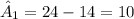
 = 24
= 24 = 4
= 4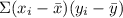 = -79
= -79 = 778
= 778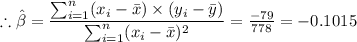


![\sum_{i}\SS_{row}_i = \sum_{i}\sum_{j} (y_{ij} - \bar y)= [(1 - 4)^2 + (6 - 4)^2 + (4 - 4)^2 + (3 - 4)^2 + (6 - 4)^2] = 18](/tpl/images/0679/3656/3ee0d.png)
![\sum_{i} S S_{row}_i = \sum_{i}\sum_{j} (y_{ij} - \bar y) ^2= [(43 - 24)^2 + (30 - 24)^2 + (22 - 24)^2 + (20 - 24)^2 + (5 - 24)^2] = 778](/tpl/images/0679/3656/1114b.png)

 = (43 - 14)² + (30 - 14)² + (22 - 14)² + (20 - 14)² + (5 - 14)² + (1 - 14)1² + (6 - 4
)² + (3 - 14)² + (6 - 14)² = 1796
= (43 - 14)² + (30 - 14)² + (22 - 14)² + (20 - 14)² + (5 - 14)² + (1 - 14)1² + (6 - 4
)² + (3 - 14)² + (6 - 14)² = 1796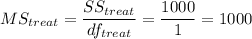
 , we reject the null hypothesis.


Other questions on the subject: Mathematics
You know the right answer?
A researcher collected data on the hours of TV watched per day from a sample of five people of diffe...
Questions in other subjects:


History, 02.09.2019 14:10
History, 02.09.2019 14:10
Physics, 02.09.2019 14:10
History, 02.09.2019 14:10


