
Mathematics, 07.06.2020 00:04 liltweetypie08ovdod4
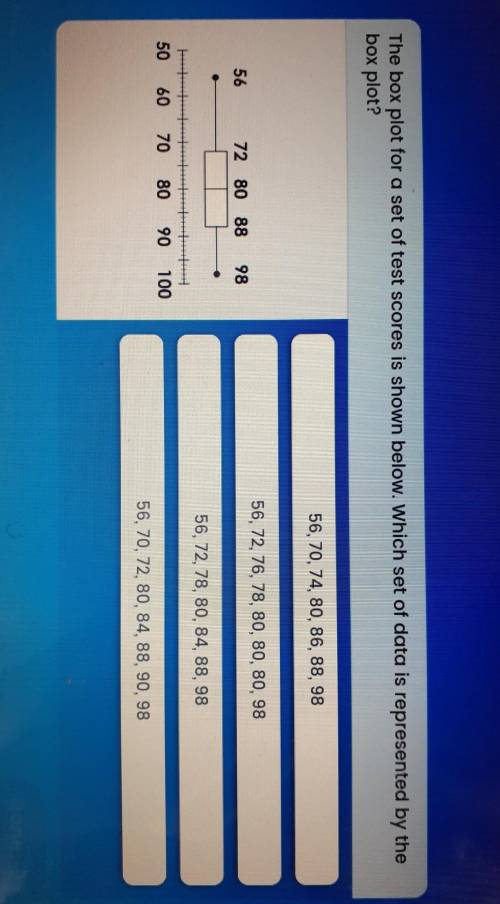
The box plot for a set of test scores is shown below. Which set of data is represented by the
box plot?
56, 70, 74, 80, 86, 88, 98
56, 72, 76, 78, 80, 80, 80, 98
56
72 80 88
98
56, 72, 78, 80, 84, 88, 98
50 60
70
80
90
100
56, 70, 72, 80, 84, 88, 90, 98

Answers: 3


Other questions on the subject: Mathematics
Mathematics, 21.06.2019 15:40, aaliyahmaile13
Yo y do yall have 2 stars that means yall wrong bro
Answers: 1
Mathematics, 21.06.2019 18:30, Lakenwilliams1250
Select 2 statements that are true about the equation y+6=-10(x-3).1) the slope of the line is -102) the slope of the line is 33) one point on the line is (3,6)4) one point on the line is (3,-6)
Answers: 1
You know the right answer?
The box plot for a set of test scores is shown below. Which set of data is represented by the
box p...
Questions in other subjects:


Physics, 14.12.2020 05:30

Spanish, 14.12.2020 05:30

Mathematics, 14.12.2020 05:30


