
Mathematics, 05.06.2020 07:00 levicorey846
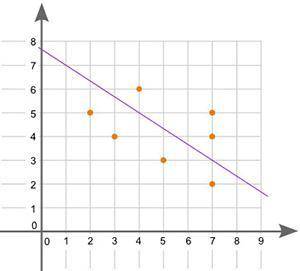
A scatter plot and a possible line of best fit is shown:
Is the line of best fit accurate for the data shown?
No, because the line does not touch any points
No, because the line should touch every point
Yes, because it touches the y-axis
Yes, because it passes through the center of the data points

Answers: 3


Other questions on the subject: Mathematics
Mathematics, 21.06.2019 12:30, christa140
The graph shows the rate at which paint is used to paint a wall. enter values to complete each statement below based on the graph. when 1 gallon of paint has been used, ( # ) square feet of the wall will be painted. the unit rate is ( # )square feet per gallon.
Answers: 2
Mathematics, 21.06.2019 18:00, sammilower04
Write an equation in slope intercept form of the line passes through the given point and is parallel to the graph of the given equation (0,0); y=3/8 x+2
Answers: 1
You know the right answer?
A scatter plot and a possible line of best fit is shown:
Is the line of best fit accurate for the d...
Questions in other subjects:


Physics, 28.04.2021 17:30

Mathematics, 28.04.2021 17:30

Mathematics, 28.04.2021 17:30


