
Mathematics, 05.06.2020 23:05 shazaam1657
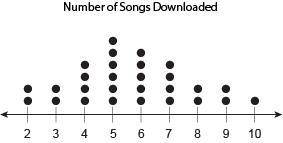
This graph shows the number of songs downloaded in a week by different people. Select from the drop-down menus to correctly complete the statement. The distribution of data is ___ (Drop down answers: Approximately normal Uniform Skewed left Skewed right), with a median of ___ (Drop down answers: 5 5.5 6 6.5), and a range of ___ (Drop down Answers: 2 8 10 12) .

Answers: 1


Other questions on the subject: Mathematics
You know the right answer?
This graph shows the number of songs downloaded in a week by different people. Select from the drop-...
Questions in other subjects:

History, 30.10.2020 15:50

Chemistry, 30.10.2020 15:50
Mathematics, 30.10.2020 15:50

English, 30.10.2020 15:50
Chemistry, 30.10.2020 15:50

Physics, 30.10.2020 15:50
Mathematics, 30.10.2020 15:50
History, 30.10.2020 15:50


