
Mathematics, 05.06.2020 02:03 dontcareanyonemo
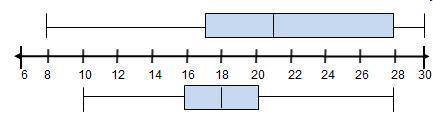
The box plots show the weights, in pounds, of the dogs in two different animal shelters.
Weights of Dogs in Shelter A
6
8
10
12
14
16
18
20
22
24
26
28
30
Weights of Dogs in Shelter B
Which describes the spread of the data in the two box plots?
O
The data in shelter A show more spread than the data in shelter B.
The data in shelter B show more spread than the data in shelter A
The data in shelter A range from about 17 to 28, while the data in shelter B range from about 16 to 20
The data in shelter A range from about 21 to 28, while the data in shelter B range from about 18 to 20.

Answers: 3


Other questions on the subject: Mathematics
Mathematics, 21.06.2019 23:30, shady1095
Asap (i need to finish this quick) graph complete the sequence of transformations that produces △x'y'z' from △xyz. a clockwise rotation ° about the origin followed by a translation units to the right and 6 units down produces δx'y'z' from δxyz.
Answers: 1
Mathematics, 22.06.2019 02:30, reneewilliams20
Alex buys a home for $276,400. his home is predicted to increase in value 3.5% each year. what is the predicted value of alex’s home in 25 years? a. 621,357 b. 635,191 c. 653,201 d. 673,415
Answers: 1
Mathematics, 22.06.2019 06:00, angelnjones42
Which of the following describes how to calculate the value of x?
Answers: 2
You know the right answer?
The box plots show the weights, in pounds, of the dogs in two different animal shelters.
Weights of...
Questions in other subjects:
Mathematics, 15.10.2020 02:01

Geography, 15.10.2020 02:01
Mathematics, 15.10.2020 02:01

Mathematics, 15.10.2020 02:01


Mathematics, 15.10.2020 02:01

Physics, 15.10.2020 02:01


