
Mathematics, 05.06.2020 02:04 annapittbull12
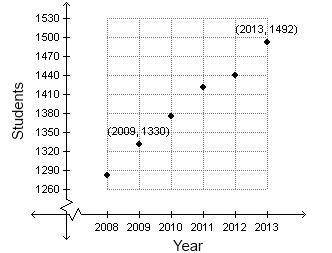
The enrollment at East Valley High School over a six-year period is displayed in the scatterplot.
Student Enrollment at East Valley High School
1530
1500
(2013, 1492)
1470
1440
.
Students
1410
1380
1350
(2009, 1330)
1320
1290
1260
2008 2009 2010 2011 2012 2013
Year

Answers: 2


Other questions on the subject: Mathematics
Mathematics, 21.06.2019 20:00, duhitzmay4693
The scatterplot below shows the number of hours that students read weekly and the number of hours that they spend on chores weekly. which statement about the scatterplot is true?
Answers: 2
Mathematics, 21.06.2019 23:00, keishadawson
Could someone me with this question i’ve been stuck on it for 20 minutes
Answers: 1
You know the right answer?
The enrollment at East Valley High School over a six-year period is displayed in the scatterplot.
S...
Questions in other subjects:

English, 17.03.2021 23:50


Mathematics, 17.03.2021 23:50

Physics, 17.03.2021 23:50
Mathematics, 17.03.2021 23:50


