
Mathematics, 03.06.2020 19:03 growingideas
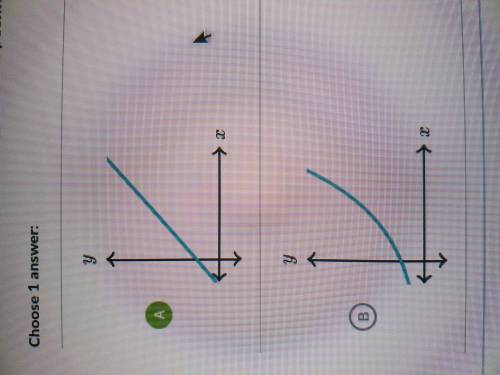
The table represents the number of milkshakes sold by a restaurant since they were added to the menu.
Time (months)Milkshakes sold
1 259
4 380
7 501
10 622
13 744
Which graph best represents the relationship between time and the number of milkshakes sold?

Answers: 1


Other questions on the subject: Mathematics
Mathematics, 21.06.2019 22:00, ihatedevin12
If abcde is reflected over the x-axis and then translated 3 units left, what are the new coordinates d?
Answers: 3
Mathematics, 21.06.2019 22:00, goodperson21
White shapes and black shapes are used in a game. some of the shapes are circles. while the rest are squares. the ratio of the number of white shapes to the number of black shapes is 5: 11. the ratio of the number of white cicrles to the number of white squares is 3: 7. the ratio of the number of black circles to the number of black squres is 3: 8. work out what fraction of all the shapes are circles.
Answers: 2
Mathematics, 21.06.2019 22:20, guesswhoitis21
Line segment eg is partitioned by point f in the ratio 1: 1. point e is at e (0, 4), and point f is at (1, 3). what are the coordinates of point g? (−1, 5) (2, 2) (3, 1) (4, 0)
Answers: 2
You know the right answer?
The table represents the number of milkshakes sold by a restaurant since they were added to the menu...
Questions in other subjects:

Mathematics, 17.12.2020 19:00
Mathematics, 17.12.2020 19:00

English, 17.12.2020 19:00
Mathematics, 17.12.2020 19:00


