
Mathematics, 02.06.2020 01:58 sadielebaron
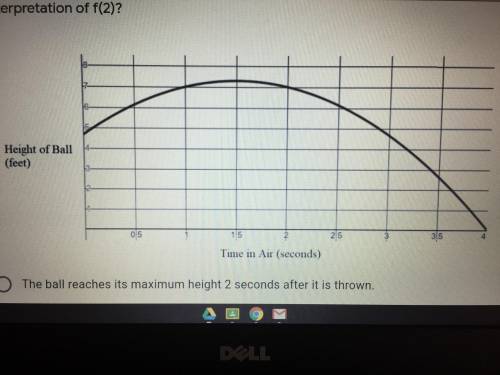
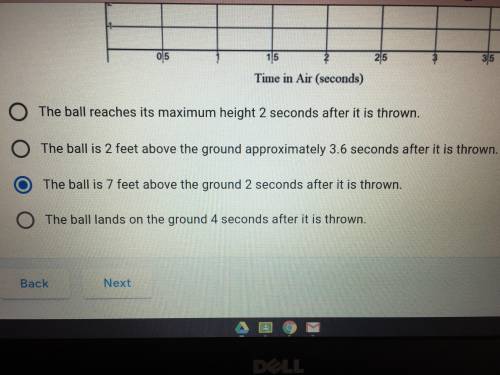
PLEASE HELP - The graph below represents the height of a football pass, in feet, x seconds after the ball is thrown. Which of the following best describes the interpretation of f(2)?
Someone said it was d. but I think it’s either b or c . so now I’m confused :(
If someone can help me they will get 20 points Pls help!
(Attached are the graph and answer choices)

Answers: 2


Other questions on the subject: Mathematics
Mathematics, 21.06.2019 19:20, SmolBeanPotato
Aefg - almn. find the ratio of aefg to almn. a)1: 4 b)1: 2 c)2.1 d)4: 1
Answers: 1
Mathematics, 21.06.2019 20:00, carltonwashington23
The midpoints of the sides of the large square are joined to form a smaller square. what is the area of the smaller square
Answers: 1
You know the right answer?
PLEASE HELP - The graph below represents the height of a football pass, in feet, x seconds after the...
Questions in other subjects:
Mathematics, 04.11.2021 18:50

History, 04.11.2021 18:50


Physics, 04.11.2021 18:50

Biology, 04.11.2021 18:50

Mathematics, 04.11.2021 18:50


