
Mathematics, 02.06.2020 20:57 rick49731
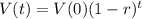
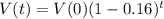
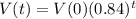
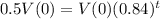
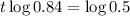
The value of a certain car decreases by 16% each year. What is the 1⁄2-life of the car?

Answers: 1


Other questions on the subject: Mathematics
Mathematics, 21.06.2019 15:30, morganwendel126
Mary used 1/7 of a spool of ribbon to complete 4 projects. she used the same amount of ribbon on each project. how much ribbon did she use on each project?
Answers: 2
Mathematics, 21.06.2019 16:00, kell22wolf
Part one: measurements 1. measure your own height and arm span (from finger-tip to finger-tip) in inches. you will likely need some from a parent, guardian, or sibling to get accurate measurements. record your measurements on the "data record" document. use the "data record" to you complete part two of this project. name relationship to student x height in inches y arm span in inches archie dad 72 72 ginelle mom 65 66 sarah sister 64 65 meleah sister 66 3/4 67 rachel sister 53 1/2 53 emily auntie 66 1/2 66 hannah myself 66 1/2 69 part two: representation of data with plots 1. using graphing software of your choice, create a scatter plot of your data. predict the line of best fit, and sketch it on your graph. part three: the line of best fit include your scatter plot and the answers to the following questions in your word processing document 1. 1. which variable did you plot on the x-axis, and which variable did you plot on the y-axis? explain why you assigned the variables in that way. 2. write the equation of the line of best fit using the slope-intercept formula $y = mx + b$. show all your work, including the points used to determine the slope and how the equation was determined. 3. what does the slope of the line represent within the context of your graph? what does the y-intercept represent? 5. use the line of best fit to you to describe the data correlation.
Answers: 2
Mathematics, 21.06.2019 20:30, jmcd10
Create a question with this scenario you could ask that could be answered only by graphing or using logarithm. david estimated he had about 20 fish in his pond. a year later, there were about 1.5 times as many fish. the year after that, the number of fish increased by a factor of 1.5 again. the number of fish is modeled by f(x)=20(1.5)^x.
Answers: 1
Mathematics, 22.06.2019 03:00, ernestsbaby6181
Crickets can jump with a vertical velocity of up to 14 ft/s. which equation models the height of such a jump, in feet, after t seconds? h(t) = –16t2 + v0t + h0 h(t) = –16t2 + v0t + 14 h(t) = –16t2 + 14t h(t) = –16t2 + 14t + 14 what is the maximum height the cricket reaches? round to the nearest thousandth. h = feet
Answers: 1
You know the right answer?
The value of a certain car decreases by 16% each year. What is the 1⁄2-life of the car?...
Questions in other subjects:


English, 25.11.2019 10:31
Mathematics, 25.11.2019 10:31

Biology, 25.11.2019 10:31
Mathematics, 25.11.2019 10:31


