Select the correct answer from each drop-down menu.
Interpret the histogram of Gretchen’s data...

Mathematics, 02.06.2020 20:58 theflash077
Select the correct answer from each drop-down menu.
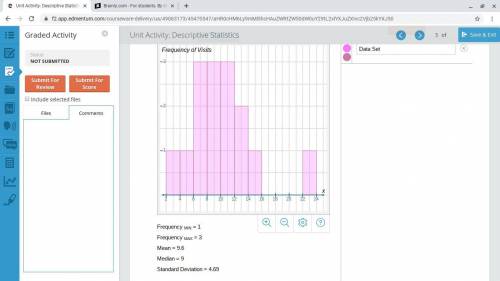
Interpret the histogram of Gretchen’s data you created (pictured below)
The shape of Gretchen’s data can be described as.
1.)Skewed left
2.)Skewed right
3.)Symmetrical
Because of this, the...
1,)Mean
2.)Median
would be the best measure of center for this data set. The actual value for the best measure of center is...
1.)7
2.)9
3.)9.1
4.)9.6

Answers: 3


Other questions on the subject: Mathematics
Mathematics, 21.06.2019 18:00, alyssatamayo641
What is the solution of log2 (3x - 7) = 3? 4 5
Answers: 1
Mathematics, 22.06.2019 00:20, maggie123456751
One file clerk can file 10 folders per minute. a second file clerk can file 11 folders per minute. how many minutes would the two clerks together take to file 672 folders?
Answers: 1
You know the right answer?
Questions in other subjects:
Mathematics, 03.03.2020 00:28


Biology, 03.03.2020 00:28


Mathematics, 03.03.2020 00:28


