Mathematics, 02.06.2020 16:57 nany1982
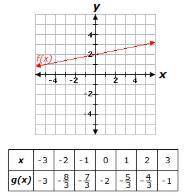
The graph below represents the function f(x), and the table below represents the function g(x).
Which statement is true?
A.
The rate of change of g(x) is equal to the rate of change of f(x).
B.
The rate of change of g(x) is greater than the rate of change of f(x).
C.
There is not enough information to determine the rate of change of g(x).
D.
The rate of change of g(x) is less than the rate of change of f(x).


Answers: 1


Other questions on the subject: Mathematics

Mathematics, 21.06.2019 13:00, darianhaynes
The first hexagon is dilated to form the second hexagon select the answers from the drop box menus to correctly complete the statement
Answers: 1

Mathematics, 21.06.2019 15:50, winterblanco
Which of the following is the equation that says that the product of a number and ten is equal to 20 percent of that number ? a) 10n= 2.0n b) 10+n=.20n c) n+ .20n=10 d) 10n=0.20n
Answers: 1

Mathematics, 21.06.2019 18:00, thompsonmark0616
What is the value of x in the equation 2(x-4) = 4(2x + 1)?
Answers: 1

Mathematics, 21.06.2019 21:00, rjsimpson73
An arithmetic series a consists of consecutive integers that are multiples of 4 what is the sum of the first 9 terms of this sequence if the first term is 0
Answers: 1
You know the right answer?
The graph below represents the function f(x), and the table below represents the function g(x).
Questions in other subjects:

Biology, 23.10.2020 14:00


Arts, 23.10.2020 14:00

Mathematics, 23.10.2020 14:00


Health, 23.10.2020 14:00

English, 23.10.2020 14:00


