
Mathematics, 01.06.2020 06:58 STAYxALIVE7814
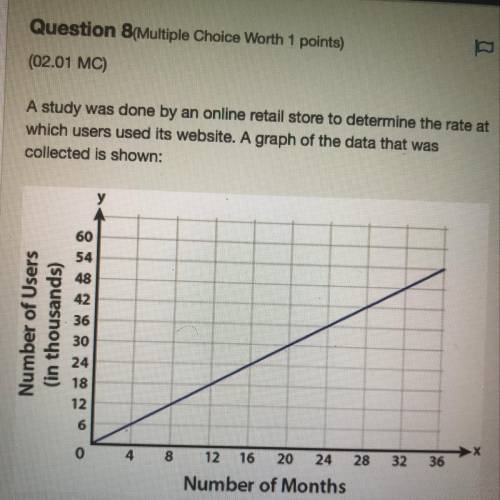
A study was done by an online retail store to determine the rate at which users used its website. A graph of the data that was collected is shown:
A. The range represents the 54 month time period of the study.
B. The range represents the 36 month time period of the study.
C. The range represents the number of users each month for 36 months.
D. The range represents the number of users each month for 54 months.

Answers: 2


Other questions on the subject: Mathematics
Mathematics, 21.06.2019 20:00, kennrecklezz
Which of these tools or constructions is used to inscribe a hexagon inside a circle?
Answers: 1
Mathematics, 22.06.2019 01:00, christinaruckepegvlp
What is 10+10+20 about the origin the square root of a triangle.
Answers: 3
Mathematics, 22.06.2019 03:00, jjgurl60
Ashley spent half of her lunch money on a turkey sandwich. then she spent two-thirds of the money she had left on a bottle of juice and the rest of the money on a cookie. if the cookie cost $.75, how much lunch money did ashley have to start with?
Answers: 2
You know the right answer?
A study was done by an online retail store to determine the rate at which users used its website. A...
Questions in other subjects:

Mathematics, 08.04.2021 05:00
Mathematics, 08.04.2021 05:00
Mathematics, 08.04.2021 05:00

Chemistry, 08.04.2021 05:00


