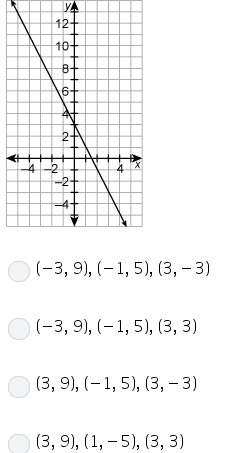
Which models best illustrates the inequality and its graph?
t > 60
A.) Ti...

Mathematics, 31.05.2020 08:58 steven2996
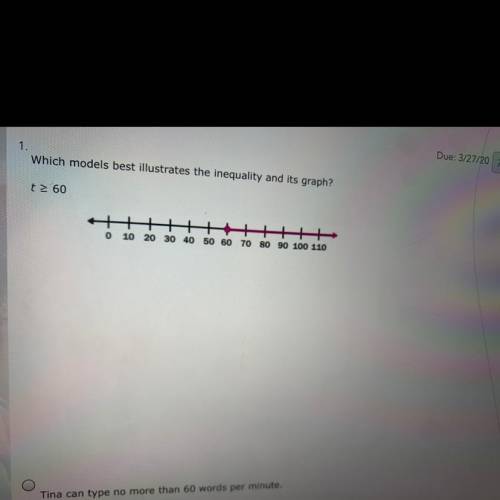
Which models best illustrates the inequality and its graph?
t > 60
A.) Tina can type no more than 60 words per minute
B.) Tina can type at least 60 words per minute
C.) Tina can type more than 60 words per minute
D.) Tina can type at most 60 words per minute

Answers: 1


Other questions on the subject: Mathematics
Mathematics, 21.06.2019 17:10, Andrewecolt1993
Which is a graph of a proportional relationship?
Answers: 1
You know the right answer?
Questions in other subjects:

History, 23.01.2020 09:31

English, 23.01.2020 09:31
Mathematics, 23.01.2020 09:31
Mathematics, 23.01.2020 09:31

Chemistry, 23.01.2020 09:31
Mathematics, 23.01.2020 09:31
Mathematics, 23.01.2020 09:31


