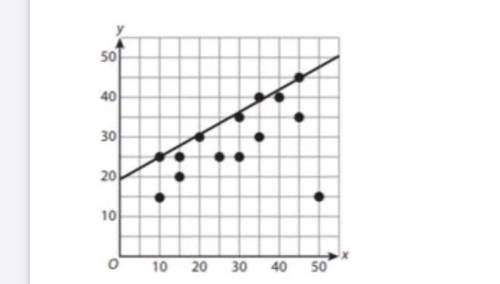
Which statement best explains whether the trend line is a good fit for the data?
❏ The t...

Mathematics, 01.06.2020 05:58 jbrowley
Which statement best explains whether the trend line is a good fit for the data?
❏ The trendline is a good fit for the data because it passes through two of the data points.
❏The trendline is not a good fit for the data because there is an outlier.
❏The trendline is not a good fit for the data because most of the data points are below the trendline.
❏The trendline is a good fit for the data because the data represents a positive association and the line has a positive slope.

Answers: 2


Other questions on the subject: Mathematics
Mathematics, 22.06.2019 00:30, byrdkellykellybyrd
Suppose that the function f is defined. , for all real numbers, as follows. _ \ 1/4x² -4 if x≠ -2 f(x)=< /_-1 if x=-2 find f(-5), f(-2), and f(4)
Answers: 3
Mathematics, 22.06.2019 01:40, ptanner706
Ahigh-altitude spherical weather balloon expands as it rises, due to the drop in atmospheric pressure. suppose that the radius r increases at the rate of 0.02 inches per second, and that r = 36 inches at time t = 0. determine the equation that models the volume v of the balloon at time t, and find the volume when t = 360 seconds. v(t) = 4π(0.02t)2; 651.44 in3 v(t) = 4π(36 + 0.02t)2; 1,694,397.14 in3 v(t) = four pi times the product of zero point zero two and t to the third power divided by three.; 4,690.37 in3 v(t) = four pi times the quantity of thirty six plus zero point zero two t to the third power divided by three.; 337,706.83 in3
Answers: 1
Mathematics, 22.06.2019 02:30, misk980
Atrain traveled for 1.5 hours to the first station, stopped for 30 minutes, then traveled for 4 hours to the final station where it stopped for 1 hour. the total distance traveled is a function of time. which graph most accurately represents this scenario? a graph is shown with the x-axis labeled time (in hours) and the y-axis labeled total distance (in miles). the line begins at the origin and moves upward for 1.5 hours. the line then continues upward at a slow rate until 2 hours. from 2 to 6 hours, the line continues quickly upward. from 6 to 7 hours, it moves downward until it touches the x-axis a graph is shown with the axis labeled time (in hours) and the y axis labeled total distance (in miles). a line is shown beginning at the origin. the line moves upward until 1.5 hours, then is a horizontal line until 2 hours. the line moves quickly upward again until 6 hours, and then is horizontal until 7 hours a graph is shown with the axis labeled time (in hours) and the y-axis labeled total distance (in miles). the line begins at the y-axis where y equals 125. it is horizontal until 1.5 hours, then moves downward until 2 hours where it touches the x-axis. the line moves upward until 6 hours and then moves downward until 7 hours where it touches the x-axis a graph is shown with the axis labeled time (in hours) and the y-axis labeled total distance (in miles). the line begins at y equals 125 and is horizontal for 1.5 hours. the line moves downward until 2 hours, then back up until 5.5 hours. the line is horizontal from 5.5 to 7 hours
Answers: 1
Mathematics, 22.06.2019 04:50, landowatson123
Astudy claims that the mean age of online dating service users is 40 years. some researchers think this is not accurate and want to show that the mean age is not 40 years. identify the null hypothesis, h0, and the alternative hypothesis, ha, in terms of the parameter μ. select the correct answer below: h0: μ≥40; ha: μ< 40 h0: μ≤40; ha: μ> 40 h0: μ≠40; ha: μ=40 h0: μ=40; ha: μ≠40
Answers: 3
You know the right answer?
Questions in other subjects:


Health, 13.07.2020 21:01
Mathematics, 13.07.2020 21:01
Mathematics, 13.07.2020 21:01


