
Mathematics, 31.05.2020 16:57 libi052207
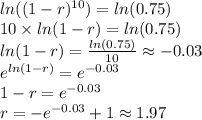
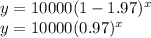
The table shows the estimated number of bees, y, in a hive x days after a pesticide is released near the hive.
A 2-column table with 6 rows. The first column is labeled number of days with entries 0, 10, 20, 30, 40, 50. The second column is labeled estimated number of bees with entries 10,000; 7,500; 5,600; 4,200; 3,200; 2,400.
Which function best models the data?
y = 9,958(0.972)x
y = 0.972(9,958)x
y = 9,219x– 150
y = –150x + 9,219

Answers: 2
 represents days and
  represents bees.
 , which represenst an exponential decary, because in this case, the number of bees decays.
 , because it starts with 10,000 bees.
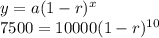
 , we have
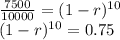


Other questions on the subject: Mathematics
Mathematics, 21.06.2019 20:00, lorip7799ov3qr0
The total number of dental clinics total for the last 12 months was recorded
Answers: 3
Mathematics, 21.06.2019 21:00, datgamer13
Mr. zimmerman invested $25,000 in an account that draws 1.4 interest, compouneded annually. what is the total value of the account after 15 years
Answers: 1
Mathematics, 21.06.2019 21:30, kimlyn58p0wyn0
The price of a dozen eggs was $1.63. suppose the price increases m dollars per dozen and then the price decreases $0.12 per dozen. which expression represents the current price of eggs after the two price changes?
Answers: 1
Mathematics, 21.06.2019 21:50, byrdkellykellybyrd
What is the rate for one gallon of gasoline
Answers: 3
You know the right answer?
The table shows the estimated number of bees, y, in a hive x days after a pesticide is released near...
Questions in other subjects:
Mathematics, 05.02.2021 01:00
Mathematics, 05.02.2021 01:00

English, 05.02.2021 01:00
Mathematics, 05.02.2021 01:00

History, 05.02.2021 01:00
Mathematics, 05.02.2021 01:00
Mathematics, 05.02.2021 01:00

Computers and Technology, 05.02.2021 01:00


