
Mathematics, 30.05.2020 15:58 XOsam
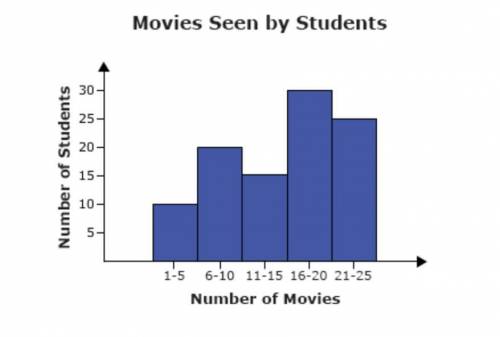
The number of movies seen by students in the 6th grade in the past year is shown in the histogram below. Which of the following statements is true for the data?
A. The majority of students have seen between 6 and 15 movies.
B. The majority of students have seen between 21 and 25 movies
C. The number of movies seen by students in the 6th grade range between 1 and 25.
D. The number of movies seen by students in the 6th grade range between 1 and 15.

Answers: 3


Other questions on the subject: Mathematics
Mathematics, 21.06.2019 16:00, alex12everett
What is the solution to the system of equations? (–2, –8) (–1, –5) (0, –2) (2, 4)
Answers: 3
Mathematics, 21.06.2019 22:20, jimena15
As voters exit the polls, you ask a representative random sample of voters if they voted for a proposition. if the true percentage of voters who vote for the proposition is 63%, what is the probability that, in your sample, exactly 5 do not voted for the proposition before 2 voted for the proposition? the probability is
Answers: 2
You know the right answer?
The number of movies seen by students in the 6th grade in the past year is shown in the histogram be...
Questions in other subjects:

Mathematics, 30.11.2020 22:00


English, 30.11.2020 22:00
Mathematics, 30.11.2020 22:00


